Advanced Reporting
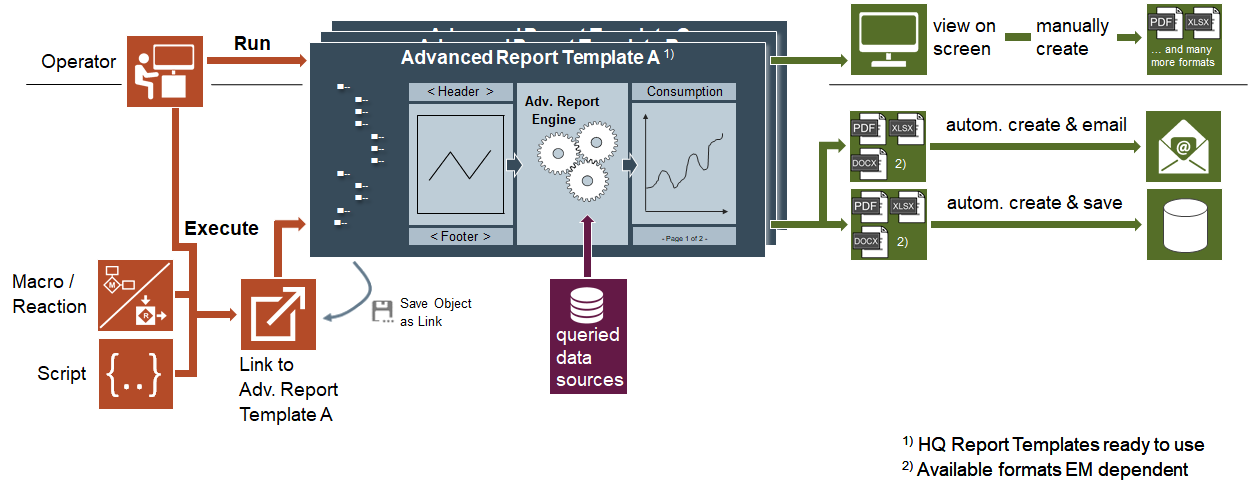
Advanced Reporting allows you to create graphical reports using elements such as charts, graphs, pie charts, images and so on. In order to work with Advanced Reporting, you must install the Advanced Reporting extension and add it to the management station project.
The management station standard Reporting does not support the elements of Advanced Reporting. Advanced Reporting uses advanced capabilities such as grouping, and OLAP Cube to generate such reports.
Advanced Reports are used for reporting data or data series from Desigo CC historic data combined with additional features such as:
- Comparisons
- Benchmarking
- Evaluations
- Calculations
- Hyperlinks
- Enhancements with other data, for example, electricity rate, KPI
These reports provide an output in the HTML format and allow you to save the report data in the following formats:
- Excel
- DOCX
Advanced Reporting reports can display data in any of the languages that are configured in your system. However, you can only view the report output in your logged-in language.
This section provides background information on Advanced Reporting of Desigo CC. For related procedures, see the step-by-step section.
The Configuration Page - Advanced Reporting displays the configuration status of advanced reporting on your system. It also provides options to further optimize the configuration settings.
This page displays the configuration according to the Simple or Advanced configurations. You can select the Simple or Advanced configurations by clicking Simple or Advanced on the page.
Review Wizard displays the configuration that you specified through the wizard when configuring advanced reporting.
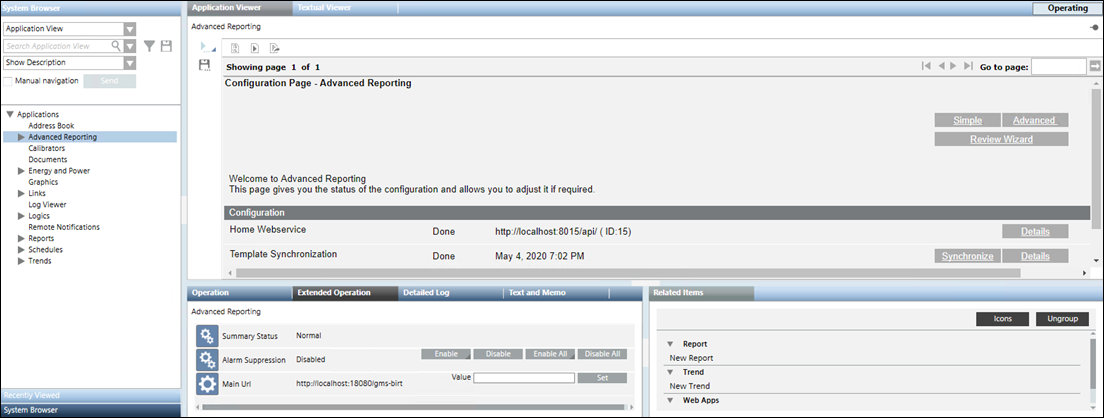
- The Simple configuration is applicable when you have installed only the Advanced Reporting extension and need to perform the basic configurations such as configuring the URL of the Home webservice and synchronize advanced reporting templates.
Simple Configuration | |
Name | Description |
Home Webservice | URL of the management station web services that updates the WSI URL in all the report templates provided by the management station. |
Details | Displays the details of the Web Services URL along with options Add, Delete and Hide the URL. |
Date and time when the report templates were transferred to the Tomcat server. | |
Synchronize | Deploys the report templates from the library to the Tomcat server. |
- The Advanced configuration is applicable when want to work with creating reports related to caching, consumption, and so on for which you need additional configurations such as caching settings, layout settings, settings for configuring the look and feel of the report elements, and so on. For more information, see Energy Reporting and Pharma Reporting extension help.
- The Review Wizard configuration is applicable when you want to view the existing configurations specified on Configure WSI and Synch Libraries page, and view or edit the configurations specified on Layout Settings and Cache Settings page.
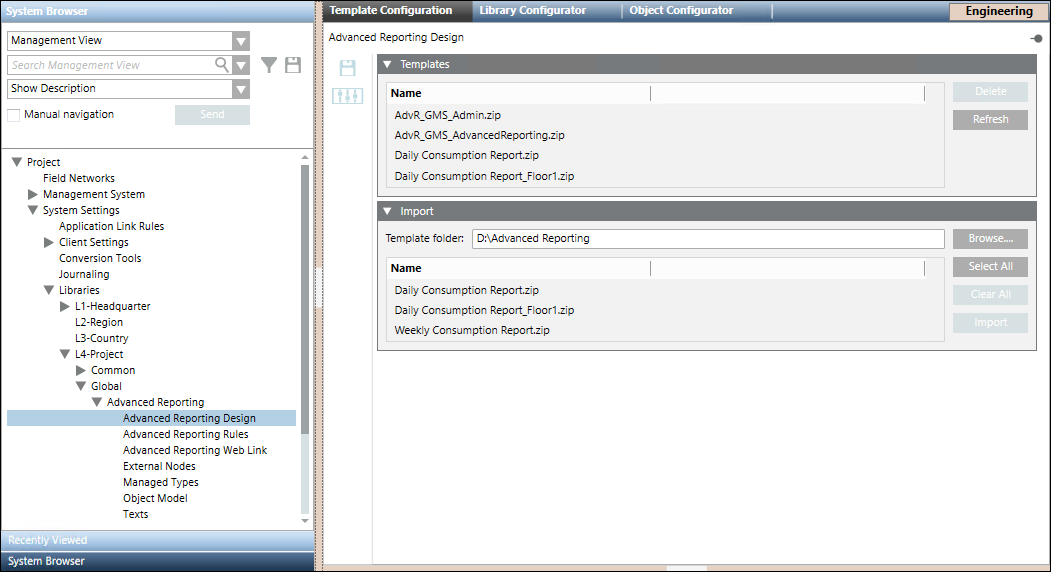
Whenever the Advanced Reporting extension is installed, the Advanced Reporting libraries are equipped with certain pre-configured report templates. (see Configure Reporting Templates)
You can either use these templates as is, or can further configure them as required. After further configuration, these templates can be deployed back to the respective libraries using the Template Configuration application. In addition to configuring pre-configured templates, you can also add new templates to these libraries using this application. Procedures relating to modifying existing templates or adding new templates to these libraries are performed by Librarians.
Using the Templates expander you can add the report templates to the respective library on the management station. It lists the report templates files that you import using the Import expander.
- Delete: Deletes a selected template.
- Refresh: Refreshes the Templates expander.
Using the Import expander you can work with the report templates using the following buttons:
- Browse: Displays the Browse folder. Select the folder where the zipped files of the BIRT report templates are present.
- Select All: Selects all the listed files.
- Clear All: Clears the files listed in the Import expander.
- Import: Imports the selected files and saves them in the Advanced Reporting folder in the selected library in the customer project.
The toolbar provides you with the following icons:
- Save: Saves the Advanced Reporting folder in the selected library of the customer project to match the number of template files in the Templates expander.
Whenever you delete a template file from the Templates expander, you must click Save in order to delete the file from the Advanced Reporting folder in the selected library.
 - Customize: Customizes the BIRT templates according to the customization level.
The Advanced Reports for Trend Calculation feature allows you to generate reports that displays result of a custom calculation between different trend log objects. It also allows you to interpolate trend data and displays it with a timestamp, having a fixed time interval. In order to work with Trend Calculation Reports, you must install the Advanced Reporting extension and add it to a management station project. The extension contains templates that allow you to generate the following reports:
- Trend Calculation Report
- Trend Calculation For XLS Report
The Trend Calculation Reporting application uses the data stored in the Desigo CC Historical Database to show customized trend calculation report.
You can also configure common parameters using the Trend Calculation Report Settings on the Configuration Page for Advanced Reporting. Once you run a report with the desired parameters, you can then schedule it to run automatically based on a trigger time and date.
For procedures or workflows, see the step-by-step section.
Trend Calculation Workspace
This section gives an overview of the Trend Calculation workspace.
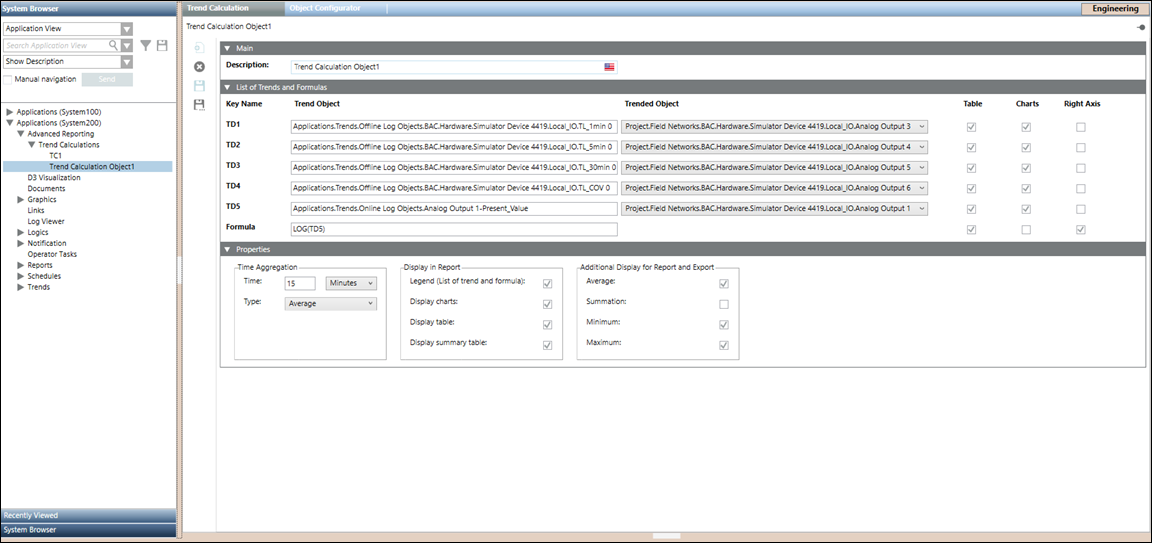
The Main expander, lets you configure the following element:
- Description: Allows you to enter the name for a trend calculation object.
The List of Trends and Formulas expander, lets you configure the following elements:
- Key Name: Allows you to identify each individual Trend Object, with a fixed name (for example, TD1, TD2, TD3, TD4, and TD5).
- Trend Object: Allows you to drag-drop either an offline trend log object, an offline trend log multiple object or an online trend log object.
- Trended Object: Displays a trended object which corresponds to each individual Trend Object.
NOTE: In case of offline trend log multiple object, you can select a corresponding trended object from the drop-down list. - Table: Allows visibility of the corresponding Trend Object and Formula in the Table section of the report.
NOTE: By default, the checkbox that displays below Table is checked which corresponds to each individual Trend Object and the Formula. - Charts: Allows visibility of the corresponding Trend Object and Formula in the Graph(s) section of the report.
NOTE: By default, the checkbox that displays below Charts is checked which corresponds to each individual Trend Object. - Right Axis: Allows visibility of the corresponding Trend Object and Formula, which is plotted on the right axis.
NOTE: By default, the checkbox that displays below Right Axis is checked for the corresponding Formula. - Formula: Allows to specify a custom formula. The following table represents the mathematical functions that are supported in the Formula field, where x represents a trend definition i.e. TD1, TD2, TD3, TD4 or TD5. Enter the mathematical functions in uppercase as they are case-sensitive, e.g. SIN, COS, TAN etc.
NOTE: If the mathematical function are specified in small letters e.g. cos, sin, tan etc. then the trend calculations are incorrect.
Function | Description |
SQRT(x) | Returns square root of x. |
EXP(x) | Returns E’x. E is Euler's number (approximately 2.7183). |
COS(x) | Returns the cosine (a value between -1 and 1) of the angle x. x is in radians. |
SIN(x) | Returns the sine (a value between -1 and 1) of the angle x. x is in radians. |
TAN(x) | Returns the tangent of x. x is in radians. |
LOG(x) | Returns the natural logarithm of x. |
POW(x)(y) | Returns the value of x to the power of y. |
The following table represents comparison and logical operators that are supported in the Formula field, where x and y represents a trend definition i.e. TD1, TD2, TD3, TD4 or TD5.
Operators | Description |
x<y | Shows 1 in the Formula field if x is less than y and 0 if x is greater than y. |
x>y | Shows 1 in the Formula field if x is greater than y and 0 if x is less than y. |
(x<9) && (y>10) | Shows 1 in the Formula field if both given conditions are true. For example, x is less than 9 and y is greater than 10. |
(x<9) || (y>10) | Shows 1 in the Formula field if one of the given conditions is true. For example, x is less than 9 or y is greater than 10. |
(x+y) != 10 | Shows 1 in the Formula field if the value is not equal to the required value. For example, the addition of x and y is not equal to 10. |
(x+y) == 25 | Shows 1 in the Formula field if the value is equal to the required value. For example, the addition of x and y is equal to 25. |
The Properties expander, lets you configure the following elements:
- Time Aggregation: Allows you to specify the time interval and select the aggregation type, for which the trend data should display with a timestamp in the report.
- Display in Report: Allows visibility of List of trends, Graph(s), Table, and Summary Table in the report.
NOTE: By default, the checkbox that displays next to Legend (List of trend and formula), Display charts, Display table, and Display summary table is checked. - Additional Display for Report and Export: Allows visibility of Average, Summation, Minimum, and Maximum in the Table section of the report.
NOTE: By default, the checkbox that displays next to Average, Minimum, and Maximum is checked.
The toolbar provides you with the following icons:
- New trend calculation folder: Allows you to create a new trend calculation folder, below the Trend Calculations node in System Browser.
- Delete: Deletes a trend calculation folder below the Trend Calculations node in System Browser.
- Save: Saves the information of a modified trend calculation object.
- Save as: Saves the information of a new trend calculation object.
Trend Calculation Report
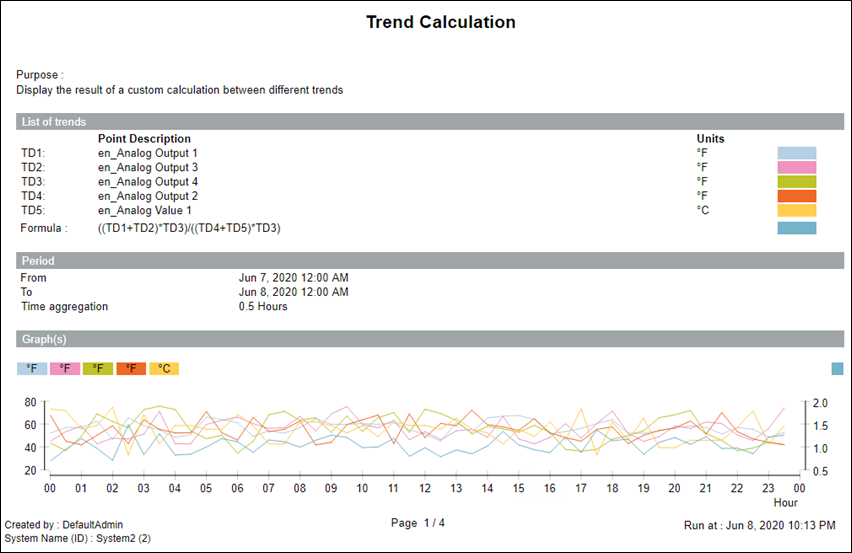
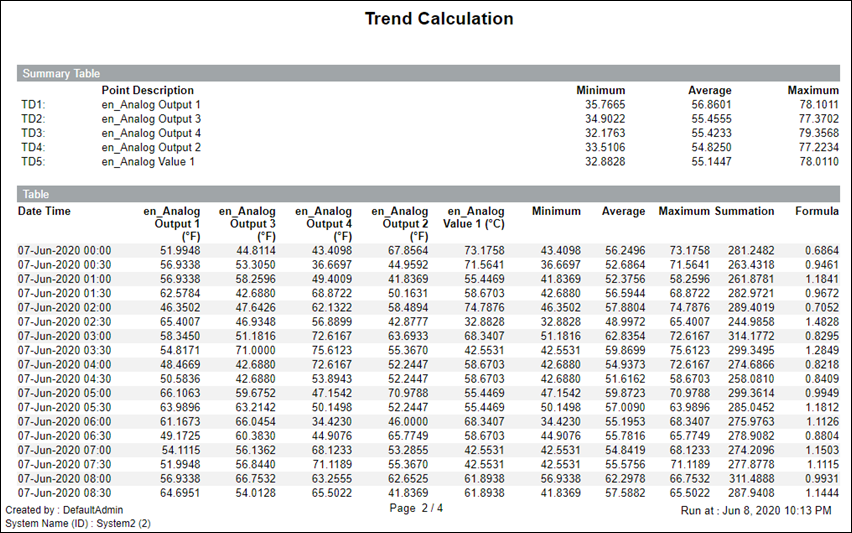
This report is designed to display a chart or table or trend data for a maximum of 5 different trend log objects, and also displays result of a custom calculation between them. The report can be adjusted with different values to be specified in the Parameter dialog box, to allow the most frequent report content.
Sample report
Indicator | Description for Table |
Asterisk - Red | Aggregation was not possible for the interval, so the last known aggregation is displayed. |
Trend Calculation For XLS Report
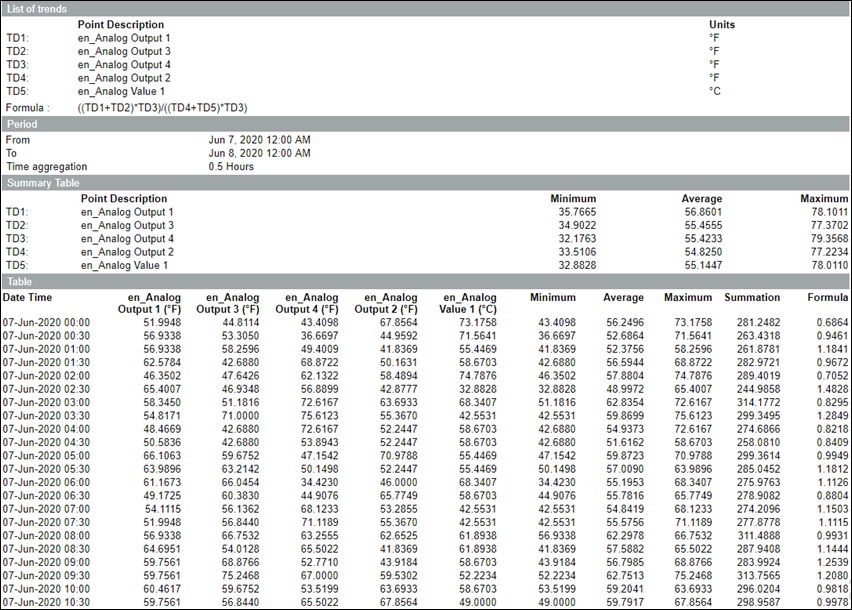
This report is designed to show values of a maximum of 5 different trend log objects, and also displays result of a custom calculation between them. It can be exported in the excel format, and various operations can be performed (for example, creating a chart). The report can be adjusted with different values to be specified in the Parameter dialog box, to allow the most frequent report content.
Sample Report
Indicator | Description for Table |
Asterisk - Red | Aggregation was not possible for the interval, so the last known aggregation is displayed. |
Link Parameters for Trend Calculation Reports
Properties of Links | ||
Parameter | Label | Value |
P1 | Report Template | Name of the report template. |
P2 | Format | Output format of the report may be PDF, HTML, XLSX, DOCX. |
P3 | Data Range | Specify Time Range for the report data. |
P4 | Alternative Title | Optional title displayed at the top of the report. |
P5 | Alternative Purpose | Optional purpose and text description displayed near the top of the report. |
P3 Link Parameters for Trend Calculation Reports
For a saved report (Advanced Reporting Links report in Application View > Applications > Links), you should use the following P3 values in the Extended Operations tab. The case and the number of spaces must match the P3 values shown in the table.
Time Range for Report Content | |
Parameter Dialog Box | P3 Value |
None | - |
Last Day | last day |
Last Week | last week |
Last Month | last month |
Last Quarter | last quarter |
Last Year | last year |
Rolling Hours | last hour |
Rolling 6 Hours | now -6hour |
Rolling 12 Hours | now -12hour |
Rolling Day | now -24hour |
Rolling Week | today -7D |
Rolling Month | today -1M |
Rolling Quarter | today -3M |
Rolling 100 Days | today -100D |
Rolling 200 Days | today -200D |
RollingYear | today -1Y |
Current Day | current day |
Current Week | current week |
Current Month | current month |
Current Quarter | current quarter |
Current Year | current year |
One year from same Day last year | current day -12M |
One year from same Week Last year | current week -12M |
One year from same Month Last year | current month -12M |
One year from same Quarter Last year | current quarter -12M |
2 Weeks ago | current week -2W |
2 Months ago | current month -2M |
2 Quarters ago | current quarter -6M |
Global Settings for Trend Calculation Reports
In the Advanced Reporting configuration page, you can set the following global settings for Trend Calculation reports.
Name | Default | Function | Reports |
Value Format Display | ##0.00 | Set the value format display in table | All |
Date format for trend | Auto | Set the date format display in table for trend chart and trend table reports. For example: | All |
Display full hierarchy name or description | false | Display the full hierarchy name or description (following object description option) for the Trended object | All |
Format used for object description | Description | Select the format used for the object description, object display with Description, Name or Alias. For Alias: if it is not defined, the | All |
Title is Object Description | false | Use the object description for title | All |
Use the Trend description for the header in table | false | Select to use trend description for the header in table By default, TD1.. TD5 will be displayed. | All |
Display the Unit in the header of the table | false | Select to display unit in the header of the table | All |
Exclude TD of the Minimum, Maximum and Average calculation if they are not set visible in table | false | Select to exclude TD of the Minimum, Maximum and Average calculation if they are not set visible in table | All |
Do not use the previous value to the calculate if value from trend is empty | false | Select if you don’t want to use the previous value to the calculate (Minimum, Maximum, Average and Formula) if value from trend is empty | All |
Time Aggregation
Time Aggregation allows you to interpolate trend data and display it with a timestamp, having a fixed time interval in the following reports:
- Trend Calculation Report
- Trend Calculation For XLS Report
Interpolation means, for every time interval derived based on the time aggregation either the minimum, maximum or average of values between that time interval is calculated. This value is displayed for each Trend Object in the Table section of the report.

NOTE:
If the Time field is either empty or has value 0 and the time unit is Minutes, then the value will be set to 5. If the Time field is either empty or has value 0 and the time unit is either Hours or Days, then the value will be set to 1. The Time field will have 15 Minutes as the default value. Time field accepts only integer values.
Advanced Reporting Trend Calculations Application Rights
The application and scope rights for trend calculations define permissions for viewing and modifying trend calculation objects, creating new trend calculation objects, and deleting existing trend calculation objects.
Trend Calculations Rights | Application Rights | Scope Rights | ||
Action | Show | Config. | Create | Delete |
| ✔ | ✘ | ✘ | ✘ |
| ✔ | ✔ | ✘ | ✘ |
| ✔ | ✔ | ✔ | ✘ |
| ✔ | ✔ | ✘ | ✔ |
The post installation steps of Advanced Reporting are used to configure the following:
- Create an Advanced Report web application (Advanced Report Web Application)
- Deploy the Advanced Reporting templates from the Advanced Reporting library to the Tomcat Server (Advanced Report Template Synchronization)
Considerations for Post Installation Step: Advanced Reporting
- Verify the post installation steps configured in the Advanced_ReportingPostInstallationConfig.txt file located in the distribution media at
…\InstallFiles\EM\Advanced_Reporting\PostInstallation for Custom, Semi, or Silent installation. - During installation of Advanced Reporting, the Post Installation folder is copied to ..\GMSMainProject\PostInstallation\EM\Advanced_Reporting and the post installation steps are executed from this location.
- (Applicable only when executing the Advanced Reporting post installation steps using Semi-automatic and Silent installation) Configure the Advanced Reporting post installation steps in the <EMs> section of the GMS Platform.xml file as follows:
- <EM Name="Advanced_Reporting">
<PostInstallationSteps>
<Step Name="AutomaticAdvRptWebAppCreation" Execute="True"/>
<Step Name="TemplateSynchronization” Execute = “True”/>
</PostInstallationSteps>
</EM> - Verify the values configured for the attribute Execute as specified in the following table.
Installation Type | GMS Platform.xml file | Post Installation Configuration in |
Custom | NA | Execute = AskUser |
Semi automatic | EM > EM Name, PostInstallationSteps | Execute = AskUser |
Silent | (Applicable only when you have specified Execute = AskUser in the Advanced_ReportingPostInstallationConfig.xml file) | Execute = Always |
Verify and Enable the Advanced Reporting Post Installation Steps
- During installation of Advanced Reporting, the Post Installation folder is copied to ..\GMSMainProject\PostInstallation\EM\Advanced_Reporting and the post installation steps are executed from this location.
- Enable the Advanced Reporting post installation steps by modifying the extension from .txt to .xml of Advanced_ReportingPostInstallationConfig.txt.
- Proceed with the management station installation along with the Advanced Reporting post installation steps execution. (see Install the Management Station)
- After the successful installation, Advanced Reporting post installation steps are also executed successfully.
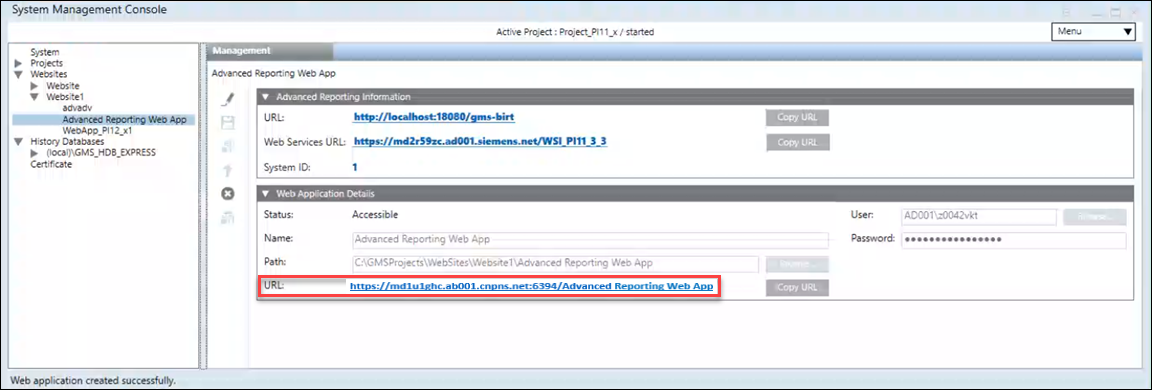
- For working with Advanced Reporting using a Windows App Client on remote computer, you must manually set the MainURL as the Advanced Reporting web application URL (https URL that displays in the Web Application Details expander). For more information, see Configure the Main URL.
- Log onto the remote computer and import the website/web application certificate (recommended is self-signed certificate) in the appropriate Windows Certificate store. See Import a Certificate in the Windows Store in Setting the Certificates as Default Certificates.
- Launch Windows App Client to work with the Advanced Reporting.
- Next, you can proceed with the configuration of reports based on the Advanced Reporting setup. For example, you can proceed with the execution of reports such as Load Profile or pharma reports.
For other additional energy reports, such as consumption, you need to first generate the cache.
For more information, see Energy Reporting extension help.
Upgrade of Advanced Reporting Using Post Installation Steps
- At least one web services application is available under Websites > [website] in the SMC tree.
- During installation of Advanced Reporting, the Post Installation folder is copied from …\InstallerDVD\InstallFiles\EM\Advanced_Reporting\PostInstallation to ..\GMSMainProject\PostInstallation\EM\Advanced_Reporting and all the post installation steps are executed from this location.
- Enable the post installation steps of Advanced Reporting, by modifying the extension of Advanced_ReportingPostInstallationConfig.txt from .txt to .xml.
- Enable post installation steps for SMC, by modifying the extension of SMCPostInstallationConfig.txt from .txt to .xml.
- Enable post installation steps for Web Service Interface, by modifying the extension of Web_Service_InterfacePostInstallationConfig.txt from .txt to .xml.
- Run either silent, semi-automatic or guided installation.
- During the upgrade installation of the Advanced Report extension, the prerequisite “Advanced Report BIRT Extension” also upgrades to latest version. The older version of Apache Tomcat and Advanced Reporting is uninstalled and a newer version is installed. During the upgrade installation, the existing configuration of the install path, port and locale is used, that is, Apache Tomcat and Advanced Reporting are installed at the location where the previous version was installed. The port assigned to the earlier version of Tomcat is assigned to a newer version of Tomcat. The locale of Advanced Reporting is set to the locale set in older version.
- The upgrade of the advanced reporting BIRT extension and the template synchronization in the post installation steps are successful. However, the Advanced Reporting web application is not upgraded by the post installation steps. You have to upgrade the Advanced Reporting web application manually by selecting the web application, clicking Edit
 and specifying the required values. For more information, see Create and Configure an Advanced Reporting Web Application in Installing and Configuring Advanced Reporting.
Fresh Installation of Advanced Reporting Using Post Installation Steps
- At least one web services application is available under Websites > [website] in the SMC tree.
- During installation of Advanced Reporting, the Post Installation folder is copied from …\InstallerDVD\InstallFiles\EM\Advanced_Reporting\PostInstallation to ..\GMSMainProject\PostInstallation\EM\Advanced_Reporting and all the post installation steps are executed from this location.
- Enable post installation steps of Advanced Reporting, by modifying the extension of Advanced_ReportingPostInstallationConfig.txt from .txt to .xml.
- Enable post installation steps for SMC, by modifying the extension of SMCPostInstallationConfig.txt from .txt to .xml.
- Enable post installation steps for Web Service Interface, by modifying the extension of Web_Service_InterfacePostInstallationConfig.txt from .txt to .xml.
- Run either silent, semi-automatic or guided installation.
- The installation of Advanced Reporting using the post installation steps is successful.
- The installation of the Advanced Reporting extension is completed with the prerequisites Advanced Reporting BIRT extension (it includes Apache Tomcat and GMS-BIRT installation). Verify that the Advanced Reporting extension is installed correctly with the following default settings:
- The installation path for Tomcat is “$SystemDrive\\Program Files\\Apache Software Foundation\\Tomcat 9.0”.
- The default connection port assigned to Tomcat server is 18080. If the default connection port is in use, then the next available free port is assigned to Tomcat.
- The LocaleName is set according to the current system’s Regional settings. To verify the regional settings, navigate to Control panel > Region > Adminstrative.
- Check the Birt_Installer_[yyyymmdd-hhmmss].txt log file to verify the default port assigned to Tomcat located at C:\ProgramData\Siemens\GMS\InstallerFramework\GMS_Prerequisites_Install_Log.
- Template synchronization using post-installation will execute and deploy the latest templates.
- Advanced reporting web application will be created in SMC.
- Verify that the Main URL is configured for Advanced Reporting extension. See Configure the Main URL for Advanced Reporting in Installing and Configuring Advanced Reporting.
- Verify the layout settings and cache settings. See Configure the Layout Settings and Configure the Cache Settings in Installing and Configuring Advanced Reporting.

Advanced Reporting Fails to Install
Problem: Installation of Advanced Reporting MSI fails, is aborted or interrupted.
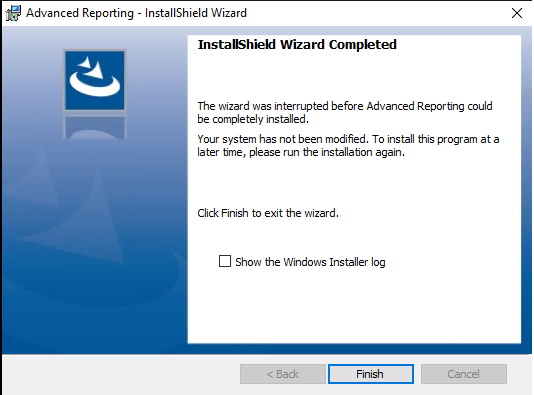
Cause: During installation of the Advanced Reporting MSI, various User Account Control pop-up messages display. The installation fails in the following situations:
a) If you do not respond to these messages by clicking Yes within 2 minutes, the pop-up messages disappear and the installation fails.
b) If you respond to any of these messages by clicking No, the pop-up messages disappear and the installation fails.
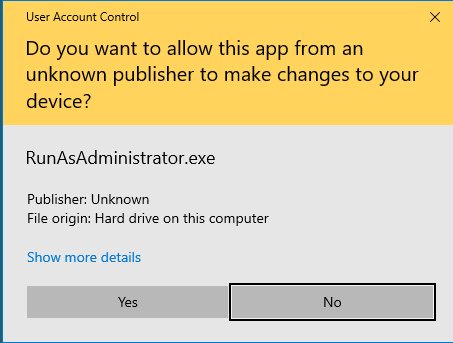
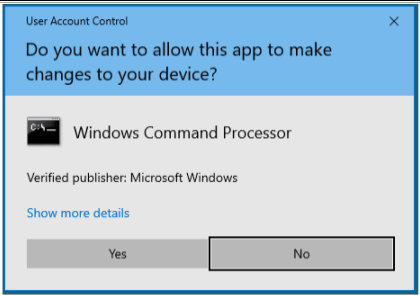
Solution: Reinstall the Advanced Reporting MSI by ensuring that you respond to all the User Account Control pop-up messages by clicking Yes within 2 minutes of the pop-up message appearing.
Tomcat Service Fails to Start
Problem: Tomcat service fails to start, if it is manually restarted or on restarting the machine.
Cause: JRE is upgraded to a higher version by auto update.
Solution:
- Check if the version of JRE home in the environment variables matches with the installed JRE version.
- You can check the installed JRE version by navigating to the following folder ..\Program Files\Java. The name of the JRE folder, for example, jre1.8.0_131, below the Java folder indicates the installed JRE version.
- To check the version of JRE home in environment variables, navigate to the Control Panel > System > Advanced System Settings. In the System Properties dialog box, click Environment Variables. In the System variables section, search for JRE_Home. The version of the JRE_Home environment variable displays in the Value column.
- Check if the version of the JRE_Home variable matches with the version of the installed JRE.
- If the value of the JRE_Home is different, then set its version to that of the installed JRE version. For example, JRE_HOME=..\Program Files\Java\jre1.8.0_131.
- Navigate to ..\Program Files\Apache Software Foundation\Tomcat 9.0\bin and run the Tomcat9w.exe file.
- In the Apache Tomcat 9.0 Tomcat9 Properties dialog box, click the Java tab and set the value of the Java Virtual Machine to ..\Program Files\Java\jre1.8.0_131\bin\server\jvm.dll.
- Restart the Tomcat service.
Problem: Tomcat service fails to start, if CCom port is running on the port number 8005.
Cause: CCom port is using the port number 8005.
Solution:
Ensure that the CCom port is not running on the port number 8005.
No Access to View Reports
Problem: The message No access to view this report displays when executing a report.
Cause 1: When you run an Advanced Report in the Application Viewer you are actually running it under the Default Web Client with its assigned scope and application rights. This applies also to the Advanced Reporting - Configuration Page. In the case of the HQ TBS, BA and FS project templates the Default Web Client is associated with the DefaultStations security group. This Management Station security group uses the Default Authorization Scope and reduced application rights to restrict the rights when accessing the project with a Web Client. In the case of HQ TBS, BA and FS project templates, the Application View , for example, is excluded. This is why the system denies the Default Web Client access to the Application View.
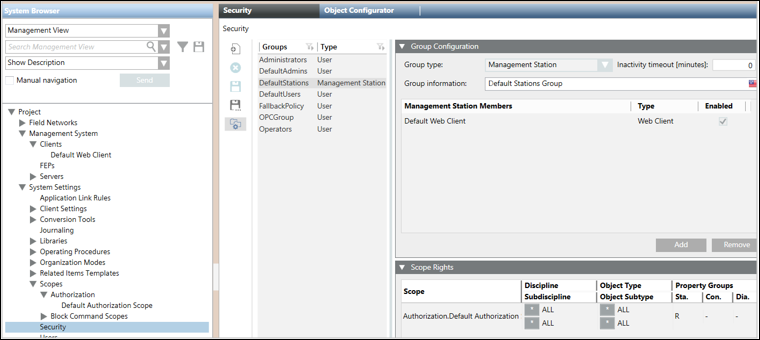

Solution 1: Remove the Default Web Client from the DefaultStations security group.
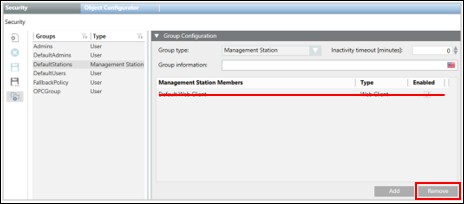
Cause 2: Status of the Web Services (WSI) service in the Manager Details expander of the project in SMC is Initializing.

Solution 2: In case there are several running projects on the same server (SMC), verify that each project has a unique Web Service port number.

Cause 3: Status of the Web Services (WSI) service in the Manager Details expander of the project in SMC is Stopped (and possibly Mode = manual).
Solution 3: Open WinCC OA Console and fix the issue.
Display of Script Error
Problem: Script error displays on accessing the advanced / energy / pharma report in Application Viewer from the Remote Client.
Cause: Internet Explorer classified the web application as unsafe and denied access.
Solution:
Open Internet Options and add your website / web application URL to Trusted Sites.
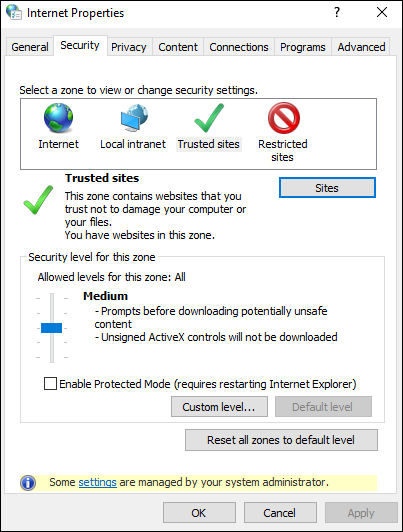
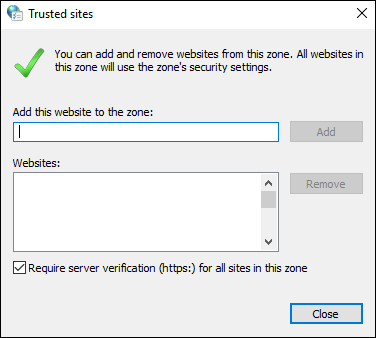
Media Group Selection in the Parameter Dialog Box does not show Expected Values
Problem: Media Group selection in the Parameter dialog box does not show expected values.
Cause: The Default Web Client's Management Station Security Group restricts the access.

Solution: Remove the Default Web Client from the DefaultStations Security Group to grant access. (See No Access to View Reports for more information).

Generated Report Cannot be Opened with a Link, Macro, or Reaction
Problem: Generated report cannot be opened with a Link, Macro, or Reaction
Cause 1: The Credentials of Link is not set or is invalid.
Solution 1: Navigate to the Link and set credentials in Application Viewer with an account that has full system access rights.
Cause 2: The file format property of the link (P2 Value) is not the same as set in Execute expander of link or command column of the macro or reaction.
Solution 2: Ensure that the file format is the same everywhere.
